Warehouse Simulator
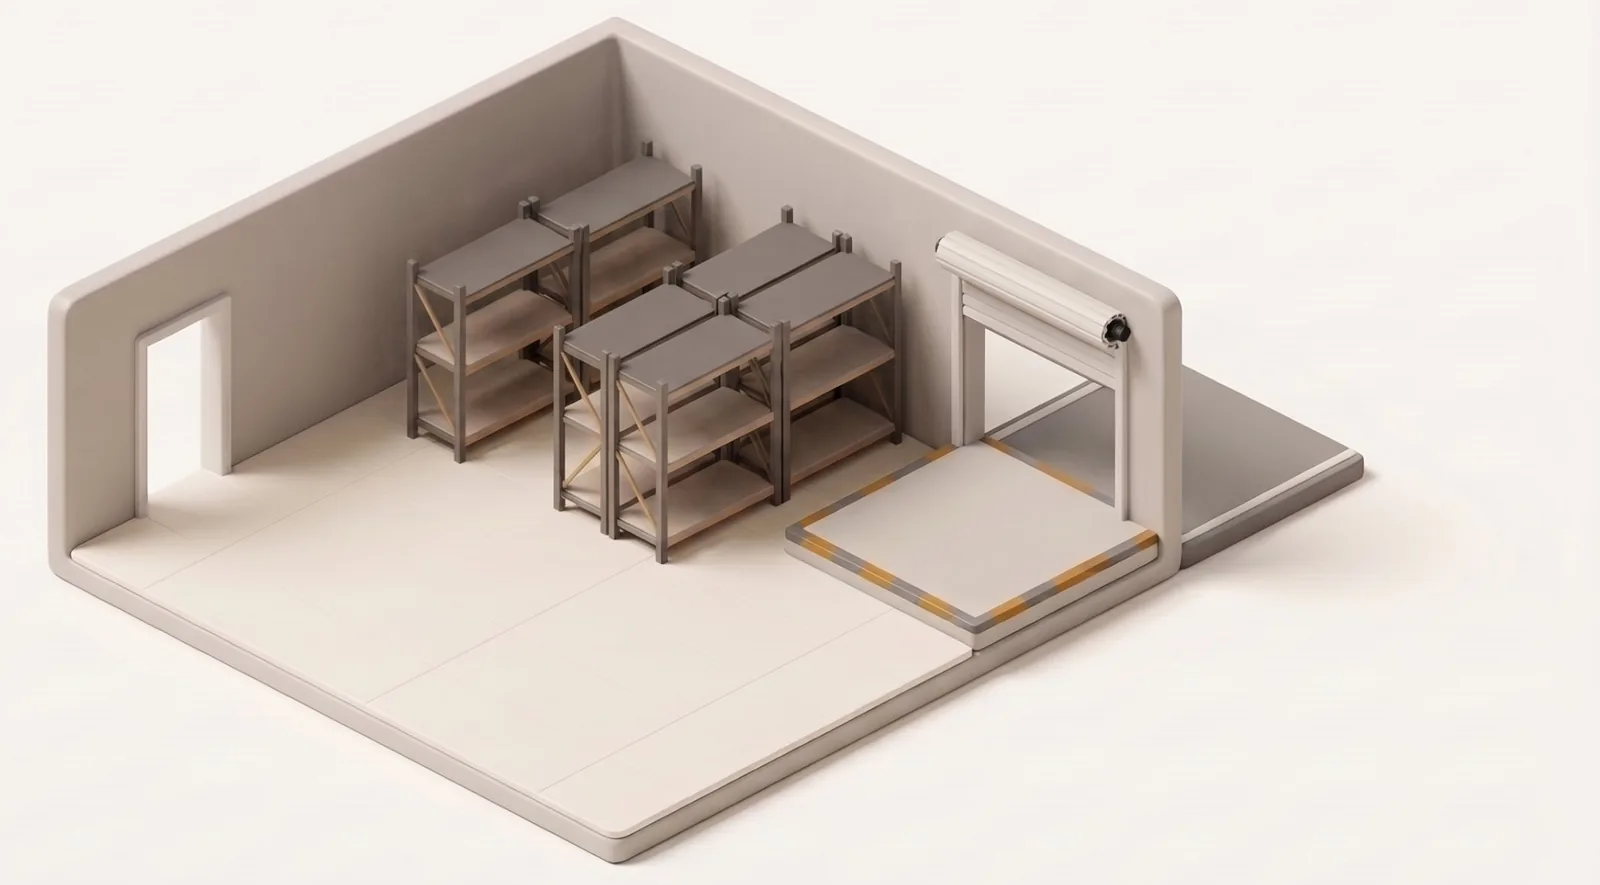
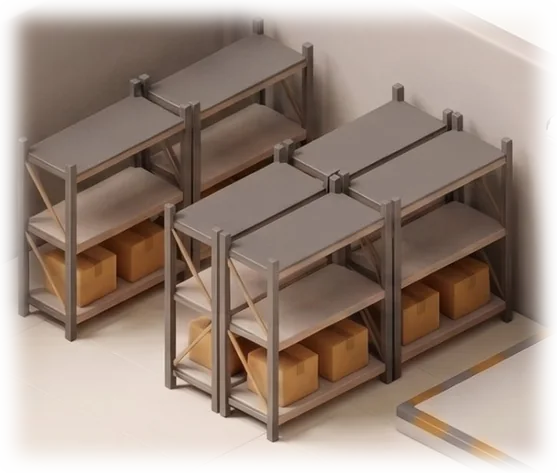
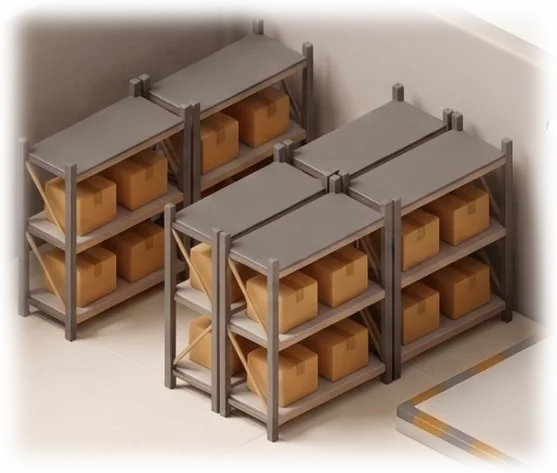
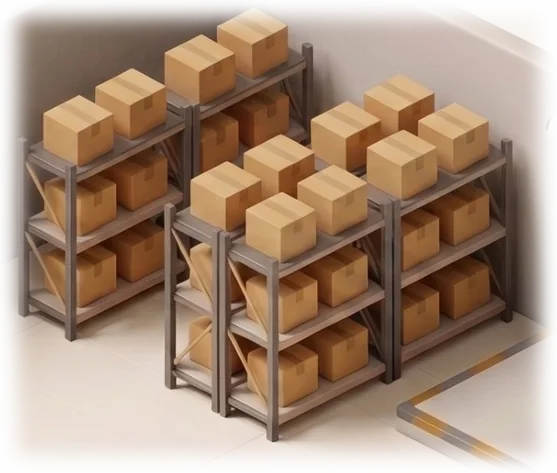
Watch a warehouse for up to 90 days. Customers come in through the front door and take stock from the shelves; as the shelves empty, orders are placed; when the lead time has passed, a truck arrives at the loading dock and refills them. When the stock runs out, customers leave empty-handed.
Change the demand, the lead time and the reorder levels, and see what each does to the service level. The simulator is the visual companion of the Order Quantity Calculator.
- Day
- 1 of 90
- Stock on hand
- 80
- On order
- 0
- Days out of stock
- 0
- Unmet demand
- 0
- Service level
- 100.0%
Speed
Summary after 90 days
The summary appears when the simulation reaches its last day.
This is a learning simulation; real demand and supply conditions may differ.
How a day works
- The order that is due today arrives and goes onto the shelves.
- Customers are served from the stock on hand. Demand that cannot be served is lost; there are no backorders.
- If it is a review day (periodic policy) or the reorder point has been reached (continuous policy), an order is placed. It arrives after the lead time.
- The same seed always gives the same demand. “New scenario” changes the seed.
Settings
Units a day. Above 0.
Days from placing an order to its arrival. A whole number, 0 or more.
Units. Above 0.
Units. 0 or more.